Mastering the TCO Engine: A Step-by-Step Simulation Guide
Learn how to navigate the updated infrastructure TCO engine to calculate your 10-year operating costs and optimize your real estate structure.

Optimize Your Infrastructure Before You Deploy
Precision is the difference between a high-yield asset and a compliance liability. Our updated Infrastructure TCO Engine v2.1 simulates 10 years of operational costs across any US jurisdiction. Follow this guide to master the simulation.
0. Engine Overview
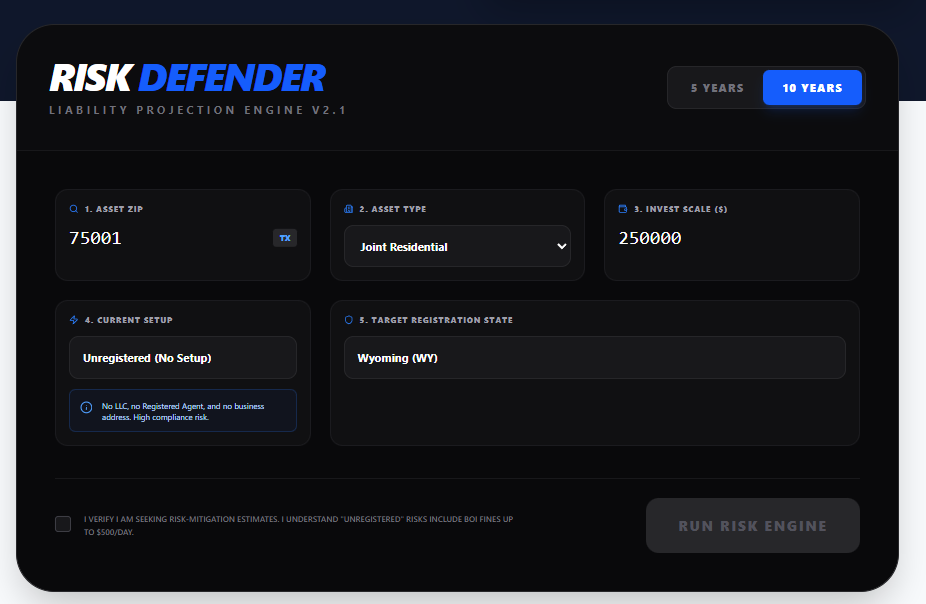
The dashboard provides a unified view of your inputs and immediate real-time feedback on risk exposure.
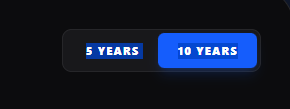
1 Set Time Horizon
Use the toggle in the header to switch between a 5-year and 10-year simulation. We recommend 10 years to fully visualize the compounding effects of annual fees and risk penalties.
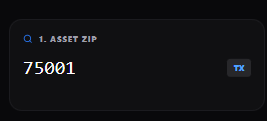
2 Identify Asset Location
Enter the 5-digit ZIP code of your physical property. The system automatically detects the state (e.g., Texas) to apply specific "Foreign Entity" qualification rules.
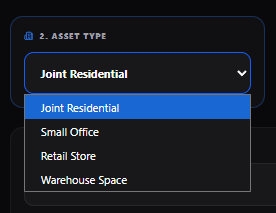
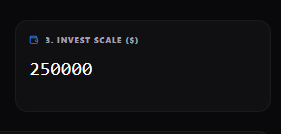
3 Define Asset Profile
Select your asset class (e.g., Residential, Retail) and Investment Scale. These inputs calibrate franchise tax calculations, which can vary significantly by state.
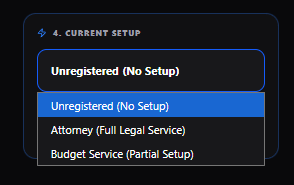
4 Current Context
Honesty is key here. Select "Unregistered" if you have no structure, or "Budget Service" if you used a basic filing service. The new Info Box will confirm your selection's definition.
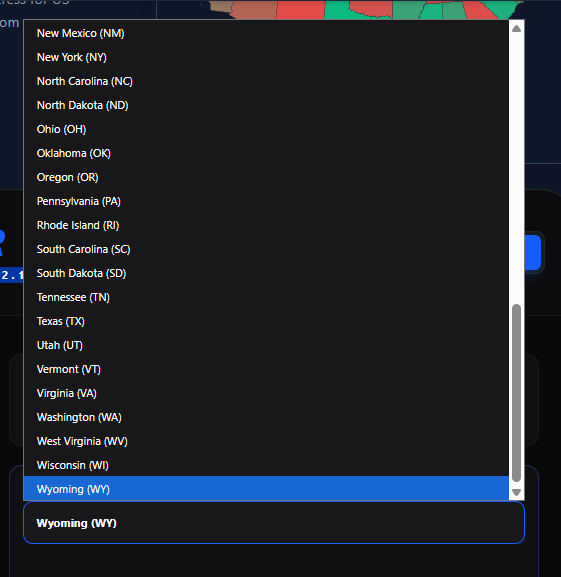
5 Target Jurisdiction
Choose your desired registration state. Typically, investors choose between the property state or a privacy-haven like Wyoming or Delaware.
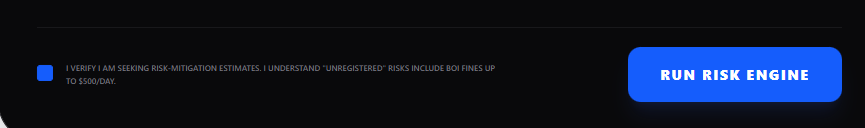
6 Execute Simulation
You must check the disclaimer box acknowledging the risk estimation nature of the tool. Then, click "Run Risk Engine" to process the algorithmic projection.
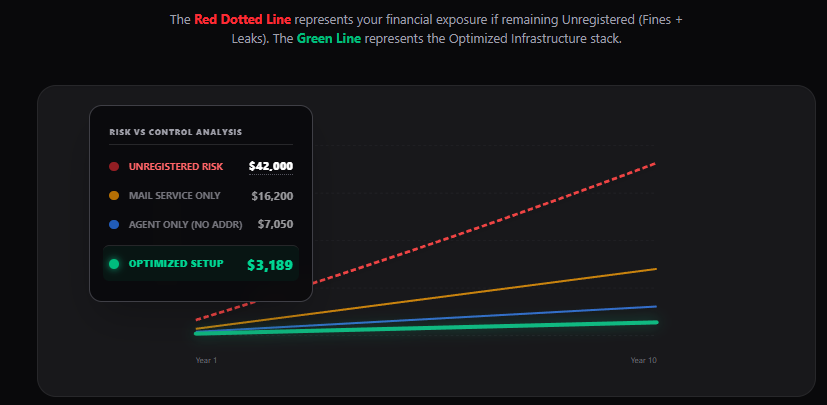
7 Analyze the Gap
The updated graph clearly visualizes the "Unregistered Risk" (Red Dotted Line) versus the "Optimized Stack" (Green Line). New tooltips provide exact dollar figures for every scenario.
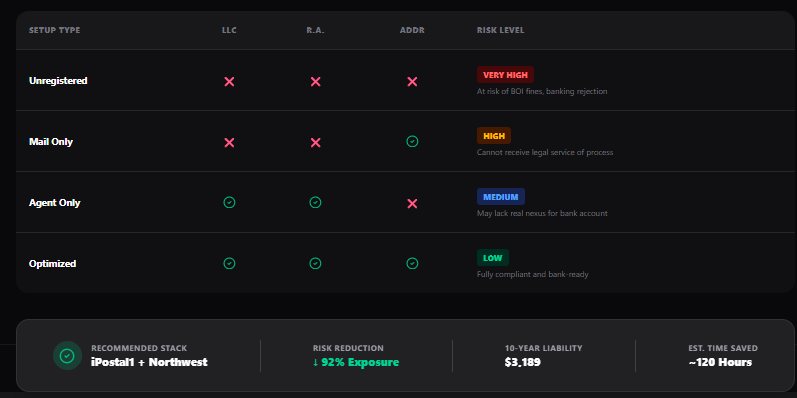
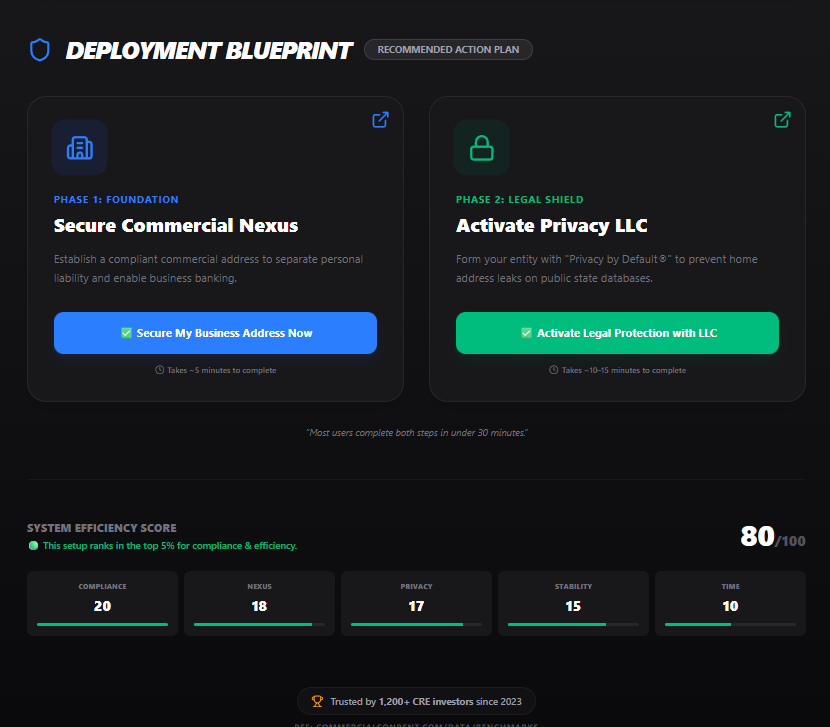
8 Review & Deploy
Below the graph, the new Summary Bridge and Comparison Table break down the exact operational gaps. Finally, use the Deployment Blueprint cards to execute the recommended stack immediately.
Next Steps
Don't leave your portfolio exposed. The data shows that an optimized setup pays for itself in avoided fines and saved time within the first year.
Ready to apply this?
Don't just read. Execute using the tool built for this exact strategy.